
1. Data foundation
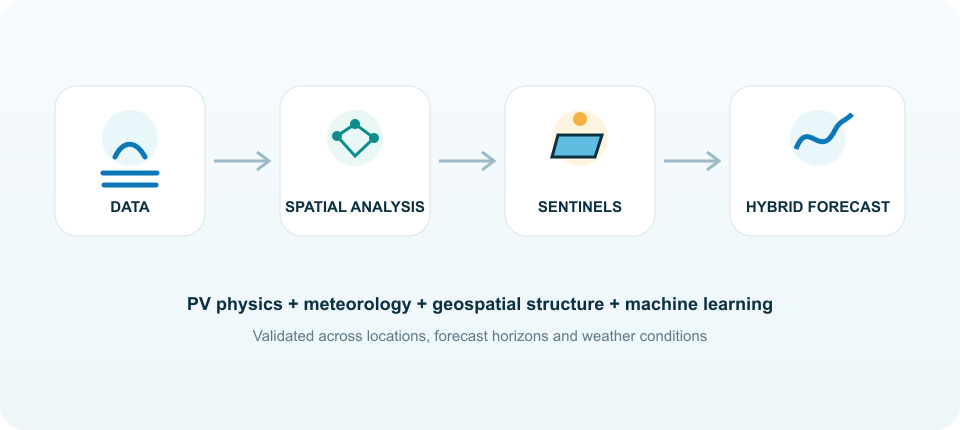
The forecasting workflow starts from a multi-source spatio-temporal dataset. Historical photovoltaic production is combined with meteorological observations, numerical weather forecasts, plant information and geospatial layers. Depending on availability, the project can integrate open data, measurements from energy stakeholders and local sensing devices used to strengthen the reference dataset.
Geospatial data describe elevation, slope, aspect, land morphology and other features that can affect local microclimates. Meteorological variables include solar irradiance, ambient temperature, cloud information and other descriptors of atmospheric conditions. Numerical forecasts provide the future weather information required for operational short-term and day-ahead prediction.
Before modelling, all sources are aligned in space and time, quality-controlled and normalised. The result is a coherent feature matrix in which production, weather and territory can be analysed together.
2. Multi-criteria spatial analysis
SentinelPV groups PV systems and geographical cells according to more than simple proximity. The spatial analysis combines historical production behaviour with meteorological and topographical descriptors in order to identify regions that are homogeneous from the point of view of photovoltaic generation.
Different regionalisation strategies are evaluated according to two criteria: whether they create meaningful spatial zones and whether the resulting zones improve the ability of sentinel plants to generalise forecasts. This keeps the clustering step directly linked to the final forecasting objective.
3. Hybrid physical and machine-learning forecasting
The forecasting engine combines two complementary sources of knowledge. A physical layer describes the expected PV response using solar geometry, irradiance on the plane of the array, module temperature effects and relevant electrical or geometrical characteristics. This layer provides an interpretable baseline grounded in photovoltaic physics.
The data-driven layer learns residual variability and nonlinear relationships from the available data. The project investigates temporal neural architectures, graph-based models and ensemble approaches capable of learning both the evolution of individual time series and the relationships among multiple locations. Physics-guided formulations are also considered to constrain data-driven models with physically meaningful information.
4. Spatial generalisation
Models trained using sentinel information are tested on locations that are not used as direct monitoring points. This cross-location validation is essential: the objective is not only to forecast the sentinels themselves, but to quantify how accurately their information can represent the rest of the territory.
Forecasts can then be generated for individual sites or aggregated over zones. By repeating the analysis at different resolutions, the project evaluates the trade-off between local accuracy, regional robustness and monitoring complexity.
5. Atmospheric anomalies and correction strategies
Particular attention is given to conditions that are poorly represented by conventional forecasting chains. Dense cloud systems, fog and aerosol events can create large short-term deviations in solar irradiance. Saharan dust transport is therefore used as an example of an atmospheric anomaly in which additional information or model correction may be needed.
Past forecasts, when available, are compared with the corresponding observations to learn systematic errors and investigate correction strategies. This creates a link between operational forecast history and the continuous improvement of predictive models.
6. Validation and benchmarking
Forecast performance is evaluated against common reference approaches, including persistence-type baselines, physical-only estimates and standard data-driven models. Metrics such as normalized mean absolute error and normalized root mean square error are complemented by the analysis of error distributions, spatial consistency and performance under different production ranges.
Validation is performed across forecast horizons, seasons, locations and selected meteorological case studies. The objective is to identify not only which model has the lowest average error, but also how stable each method is under changing conditions and how performance evolves when forecasts are aggregated spatially.